Evaluation
|

|
Evaluation Studies of the O2C 
Evaluation Studies of OptoFlow 
Evaluation Studies of the O2C
Correlation with Microspheres and cerebral venous oxygen saturation
The parameter measured by O2C were compared to "Goldstandard" in brain of piglets:
Blood flow velocity measured by O2C was compared with perfusion measured
by Microspheres.
Local
oxygen saturation measured by O2C was compared with cerebral
venous oxygen saturation.
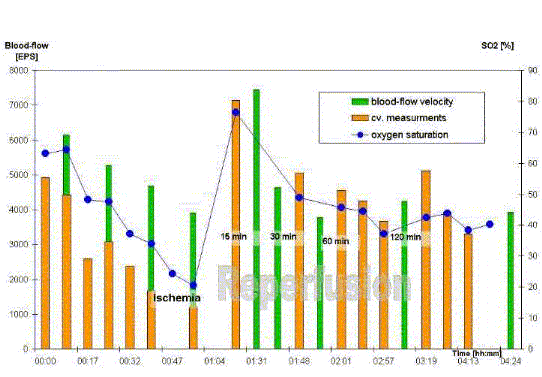
By stepwise decrease of
intracerebral perfusion pressure, perfusion of brain was decreased. The measurements
with O2C show decreasing blood flow velocity, as well as the perfusion measured
with microspheres. Also local oxygen saturation measured with O2C and cerebral
venous oxygen saturation decreased.
In the following reperfusion period all values increased and indicated reactive
hyperemia. After 30 minutes all values decrease again to a level below baseline
(Fig. 1)
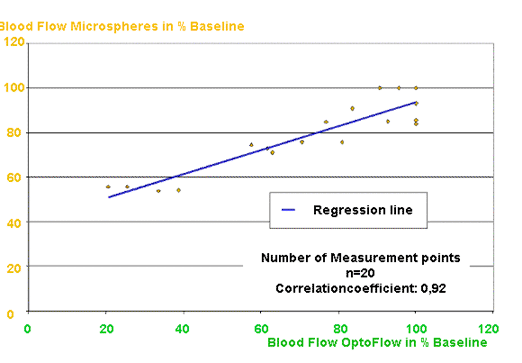
Blood flow velocity, as well as local oxygen saturation measured with O2C correlated
well with perfusion measurement by microspheres and cerebral venous oxygen saturation,
respectively (Fig. 2).

[click on figure to maximize]
Figure 1:
Local oxygen saturation (blue) and blood flow (green) determined by O2C and
cerebral venous oxygen saturation (orange) during stepwise decrease of perfusion
pressure in pig brain and following reperfusion.

[click on figure to maximize]
Figure
2: Correlation of blood flow measurement with O2C and microspheres
Reproducibility Study
In 5 volunteers the O2C
parameter were determined on 3 consecutive days. No significant changes have
been shown during this observation period.
Literature:
- A remission spectroscopy system for in vivo monitoring of hemoglobin oxygen saturation in murine hepatic sinusoids, in early systemic inflammation.
C. Wunder, R. W. Brock, A. Krug, N. Roewer, O. Eichelbrönner; Comparative Hepatology 2005; 4:1 doi:10.1186/1476-5926-4-1
- O2C relevant data extracted from "A remission spectroscopy system for in vivo monitoring of hemoglobin oxygen saturation in murine hepatic sinusoids, in early systemic inflammation"
- Redistribution of intestinal
microcirculatory oxygenation during acute hemodilution in pigs.
L.A. Schwarte, A. Fournell, J. van Bommel, C. Ince;
J Appl Physiol. 2005 Mar;98(3):1070-5. Epub 2004 Oct 8.
- Adrenomedullin reduces Staphylococcus aureus alpha-toxin-induced rat ileum microcirculatory damage.
B. Brell, B. Temmesfeld-Wollbruck, I. Altzschner, E. Frisch, B. Schmeck, A. C. Hocke, N. Suttorp, S. Hippenstiel;
Crit Care Med. 2005 Apr;33(4):819-26.
- O2C relevant data extracted from "Increase microvascular permeability and perfusion mismatch are hallmarks of sepis and spetical shock"
- Simultaneous non-invasive Fluxmetry and tissue oxygen Monitoring in fasciocutaneous Flaps
D. Nolte, Poster Münster 2002
POSTER: Combined Non-Invasiv Tissue Oxygen and Flow Monitoring in Fasciocutaneous Forearm Flaps (pdf, 123 KB)
Empho
Papers:
- Arginine
vasopressin reduces intestinal oxygen supply and mucosal tissue oxygen tension.
H. Knotzer, W. Pajk, S. Maier, R. Ladurner, A. Kleinsasser, V. Wenzel, M.W. Dunser, H. Ulmer,
W.R. Hasibeder;
Am J Physiol Heart Circ Physiol. 2005 Jul;289(1):H168-73. Epub 2005 Mar 11.
- Effects
of norepinephrine and phenylephrine on intestinal oxygen supply and mucosal tissue oxygen tension.
B. Schwarz, H. Hofstotter, N. Salak, W. Pajk, H. Knotzer, A. Mayr, B. Labeck, R. Kafka, H. Ulmer,
W.R. Hasibeder;
Intensive Care Med. 2001 Mar;27(3):593-601.
- Effects of epinephrine
on intestinal oxygen supply and mucosal tissue oxygen tension in pigs.
N. Salak, W. Pajk, H. Knotzer, H. Hofstotter, B. Schwarz, A. Mayr, B. Labeck, R. Kafka, H. Ulmer,
N. Mutz, W.R. Hasibeder;
Crit Care Med. 2001 Feb;29(2):367-73 & Crit Care Med. 2001 Feb;29(2):454-5.
- The effects of
progressive anemia on jejunal mucosal and serosal tissue oxygenation in pigs.
M. Haisjackl, G. Luz, H. Sparr, R. Germann, N. Salak, B. Friesenecker, E. Deusch, S. Meusburger,
W.R. Hasibeder;
Anesth Analg. 1997 Mar;84(3):538-44
- Effects of short-term
endotoxemia and dopamine on mucosal oxygenation in porcine jejunum.
W.R. Hasibeder, R. Germann, H.J. Wolf, M. Haisjackl, H. Hausdorfer, B. Riedmann, J. Bonatii,
E. Gruber, B. Schwarz, P. Waldenberger, B. Friesenecker, B. Furtner;
Am J Physiol. 1996 Apr;270(4 Pt 1):G667-75.
- Dopamine-1-receptor
stimulation and mucosal tissue oxygenation in the porcine jejunum.
R. Germann, W. Hasibeder, M. Haisjackl, H. Sparr, G. Luz, H. Pernthaler, B. Friesenecker, J. Bonatti,
E. Gruber, B. Schwarz;
Crit Care Med. 1995 Sep;23(9):1560-6
- Vasomotion induces
regular major oscillations in jejunal mucosal tissue oxygenation.
W.R. Hasibeder, R. Germann, H. Sparr, M. Haisjackl, B. Friesenecker, G. Luz, H. Pernthaler,
K. Pfaller, H. Maurer, O. Ennemoser;
Am J Physiol. 1994 Jun;266(6 Pt 1):G978-86
- Dopamine
and mucosal oxygenation in the porcine jejunum.
R. Germann, M. Haisjackl, W. Hasibeder, H. Sparr, G. Luz, R. Plattner, H. Pernthaler, B. Friesenecker,
M. Falk;
J Appl Physiol. 1994 Dec;77(6):2845-52
Evaluation Studies of OptoFlow
The blood flow was measured
on two consecutive days on one volunteer and on different volunteers. The inter-subject
variability of blood flow values in different depths were between 32 and 37
%. An average 5 % of intra-subject variability was observed.
Literature:
- [1] Reproducibility of
non invasive Blood Flow Measurements using Laser Doppler Spectroscopy.
M. Ghazanfari, Phys Med Rehab Kuror 2002, 12: 330-336
- [2] Laser-Doppler-Spektroskopie
und Gewebedurchblutung am Beispiel des Therapiemittels Ultraschall
L. Ott, Phys Rehab Kur Med, 1994

